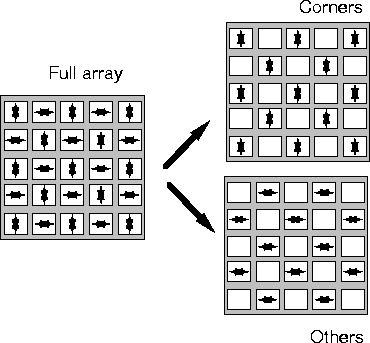
Figure 2:An illustration of the layout of
the 5x5 GMR sensor array. Each white square in the "full
array" drawing on the left represents one NVE NVS5B15 sensor.
The arrows on this drawing indicate the orientation of the
axis of sensitivity for each sensor. The right side of the
figure shows how the outputs of the elements are split up in
the images that follow.