The transition metal dichalcogenides (TMDC) were the first layered superconductors to be intensively studied. The observation of anisotropic superconductivity in these materials is not surprising considering that they contain some of the transition metal elements (Nb, Ta) that show anisotropic superconductivity in bulk form. As it turns out, the properties of the TMDC's are qualitatively similar to those of the transition metals on which they are based, only with a larger anisotropy.
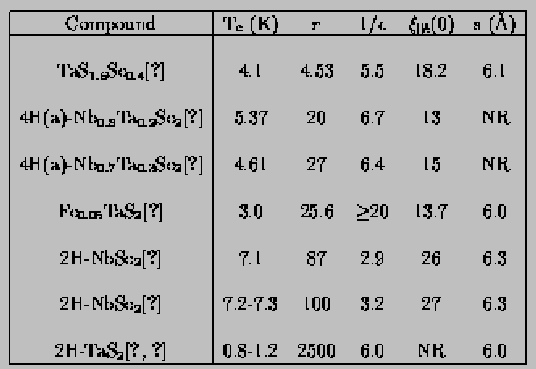
Values of the KLB parameter r (defined in Eqn. 2.4) for a number of transition metal dichalcogenides. r < 1.7 means that a 3D-2D crossover will occur at a finite temperature. s is the layer repeat distance, which is equivalent to Ic for GIC's. NR means that this parameter was not reported in the indicated reference.
Table 2.1 shows selected properties of some of the TMDC superconductors. Interest in the TMDC's derives partly from their highly anisotropic critical fields (epsilon) as large as 13.7.\cite{coleman83}) Hc2(theta) data for the prototypical TMDC superconductor, NbSe2 are shown in Figure 2.1 along with a fit to the square of Eqn. 2.1.
Besides their anisotropy, the other prominent feature of the TMDC results is the unusual temperature dependence of their critical fields. Nearly all of the TMDC's and their intercalation compounds show an extended linearity or positive curvature of their critical fields.[267] That is, Hc2(T) does not show the low-temperature saturation expected from the standard WHHM theory. This deviation from the usual theory occurs despite the fact that the TMDC's are 3D superconductors, albeit highly anisotropic ones. The unusual shape of the TMDC data are best displayed by plotting h* = Hc2 / (dHc2/dT X Tc) versus t (= T/Tc) since this plot should yield a universal curve for superconductors describable by the WHHM theory.[108] An h* versus t plot for Nb1-xTaxSe2 samples is shown in Figure 2.2. The linear behavior of the data causes it to deviate above the dashed and solid curves that show typical low-temperature saturation.[210,186] Hc2 also deviates above the WHHM prediction in the transition metals, although the effect there is smaller.[129]
Two types of superconducting TMDCIC's have been studied: one variety intercalated with alkali metal and alkaline earth atoms, and another class intercalated with large organic molecules. The first group are qualitatively similar to the pristine TMDC superconductors, only with larger angular anisotropy and greater positive curvature of Hc2(T).[266] The alkali-metal intercalation compounds based on the TMDC's appear to be 3D superconductors, just like the alkali-metal GIC's.[240] Table 2.2 shows, the three-dimensionality of the alkali intercalates of the TMDC's is demonstrated by their value of r >= 3.0. Therefore in going from the transition metals to the TMDC's to the alkali-intercalated TMDC's, qualitatively the same behavior is seen. As the number of non-superconducting layers between the transition metal layers is increased, the main trend is increasing positive curvature of the critical fields.
The alkali intercalation compounds of MoS2 are of particular interest to those working with GIC's since MoS2 is a semiconductor, but its intercalation compounds are metals with Tc on the order of 4-6 K.[220] Thus the alkali-metal intercalates of MoS2 are superconducting despite the fact that neither of the starting materials is superconducting, a situation much like that of the alkali-metal GIC's.[102] As in the alkali-metal GIC's, the occurrence of superconductivity in the alkali-metal/MoS2 compounds is attributed to charge transfer from the alkali s-bands to the bands of the host material.[220]
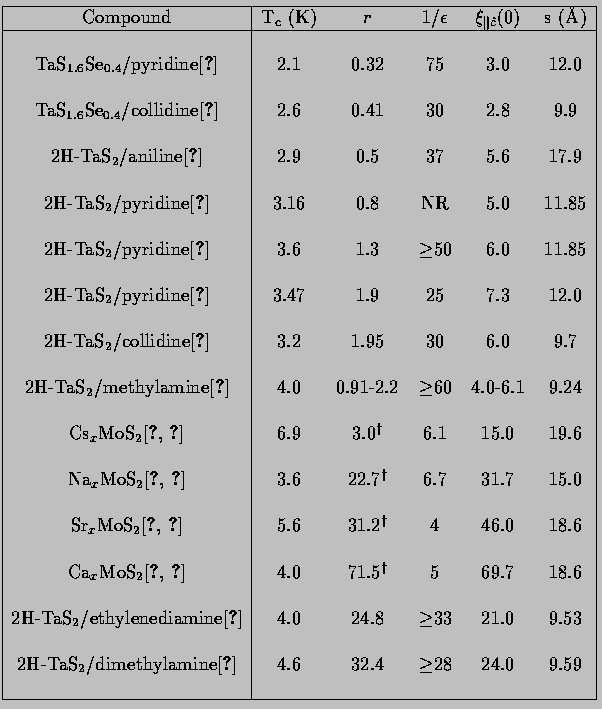
Values of the KLB parameter r for a number of transition metal dichalcogenide intercalation compounds. s is the layer repeat distance, which is equivalent to $\rm I_c$ for GIC's. Dagger means that the value of r was calculated from parameters in the cited references. NR means the parameter was not reported in the cited reference.
The transition metals which are themselves superconducting also show anomalous effects upon intercalation. The intercalation of organic molecules into several TMDC's, such as NbS2,[92] TaSe1.6Se0.4,[200] and TaSeS[175] depresses Tc. This depression is expected according to proximity-effect theories[54,49] which say that layering a superconductor with an insulator should lower Tc. On the other hand, intercalation of organic molecules into other TMDC's such as TaS2, TaSe2, and PdTe2 actually increases Tc.[92] The compounds whose Tc was enhanced by intercalation were later found to be charge-density wave (CDW) materials.[264,50] Since superconductivity and CDW's both get their condensation energy from the opening of a gap on the Fermi surface, they are competing ground states of the system. Therefore any modification (such as intercalation) that can suppress the CDW enhances superconductivity. CDW's are quite common in layered materials.[90] The possibility of a CDW in the KHg-GIC's[55] will be discussed further in Chapter 5.
Unlike the alkali-intercalated TMDC's, the organic-molecule-intercalated TMDC's show qualitatively different behavior from their parent compounds in the form of a transition from 3D to 2D coupling.[46,200] The 3D-2D crossover is manifested as a kink in the Hc2 perp c(T) curves, as shown in Figure 2.3a). Examination of the data shows that the shape of the curve does in fact change from approximately linear with temperature to approximately the square-root of temperature behavior expected in the 2D limit. The data is well-described by the KLB model of dimensionality change.[131]
As discussed in the previous section, the two signatures of 2D coupling are a square-root of T temperature dependence and a Tinkham's formula angular dependence for Hc2. Hc2(theta) data for methylamine-intercalated TaS2 are shown in Figure 2.3b) along with a fit to Eqn. 4.3.[46] The fit is much better in the 3D regime (T > T*) than in the 2D regime (T < T*), as one would expect. Unfortunately none of the research groups who have done extensive research on the TMDCIC's seem to have fit their data in the 2D regime to Tinkham's formula.[46,200]
The primary result of the critical field experiments on the TMDC's and their intercalation compounds was the first observation of a dimensionality crossover. The other notable findings are measurement for the first time of a large critical field anisotropy, and the observation of positive curvature in Hc2(T) both with and without an associated dimensionality crossover. The TMDCIC experiments are, however, limited by several factors. One is crystal quality: the samples tend to be "wrinkled" and may include several of the stable polytypes.[200] These inhomogeneities will obviously impact negatively upon any anisotropy measurements. The other problem with the TMDCIC experiments is that the critical field anisotropy is so large that accurate measurements of Hc2(theta) become quite difficult for theta near 90°. Both of these difficulties are lessened with the advent of the artificially structured superlattices described in the next section.