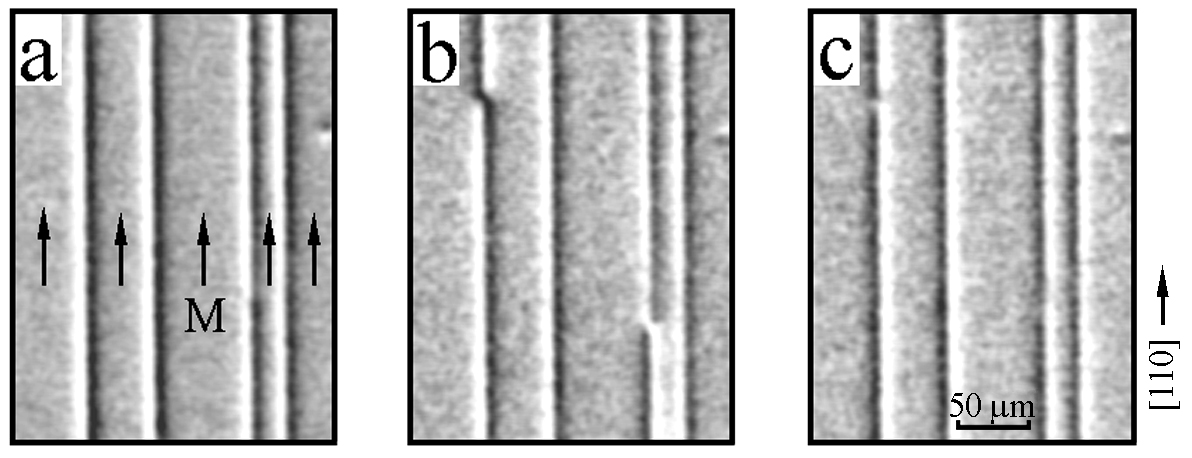
Figure 4:
MOIF images of microdomains localized on the edge dislocation slip planes in the same region of the MgO/NiO/NiFe sample. Applied field µ0H = +3 mT (a), +4.2 (b) and +6.9 (c).