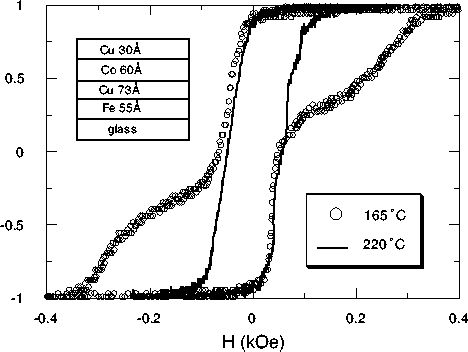
Figure 1: (a) Magnetization curves for two
Fe-Cu-Co-Cu sandwiches (see inset) grown on glass at
different deposition temperatures. The shoulder in the
magnetization of the 165 °C sample indicates the region
where the Fe and Co moments are antialigned.
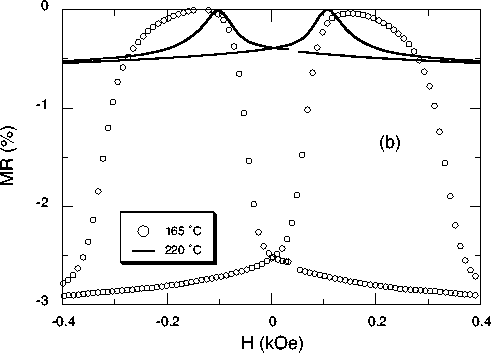
(b) Room-temperature transverse magnetoresistance curves for
the same two samples. The 220 °C sample with the square
magnetization curve has an MR trace typical for a single thin
ferromagnetic film, whereas the 165 °C sample has an
increased resistance when the moments of the two films are
antialigned.
alchaiken@gmail.com
(Alison Chaiken)
Wed Oct 11 09:49:01 PDT 1995